Here’s A Factual Chart Showing Ghafla’s Rise and Dominance Over The Competition
Every other event team Ghafla! goes to, we always get someone who wants to give us a piece of their mind about how Ghafla! is ‘losing it’ and other blanket declarations aimed at generating fear, uncertainty and doubt in our methods.
Lakini mhenga Jay-Z alinena aliposema:
“Men lie, women lie, numbers don’t.”
So in the face of all the criticism we get, we always look at the numbers to find out the real truth. One of the accurate measures of a website’s trajectory is to observe the number of people searching for the website’s brand name. This is done using a tool called Google Trends. On Google Trends, you can observe general search volumes for your brand over time, and chart graphs comparing your progress with that of your competitor’s brand name. This means that we can plot a graph of search volumes over the past 12 months for relevant entertainment publications such as Ghafla, Pulse, Niaje and Vibeweekly. See the result:
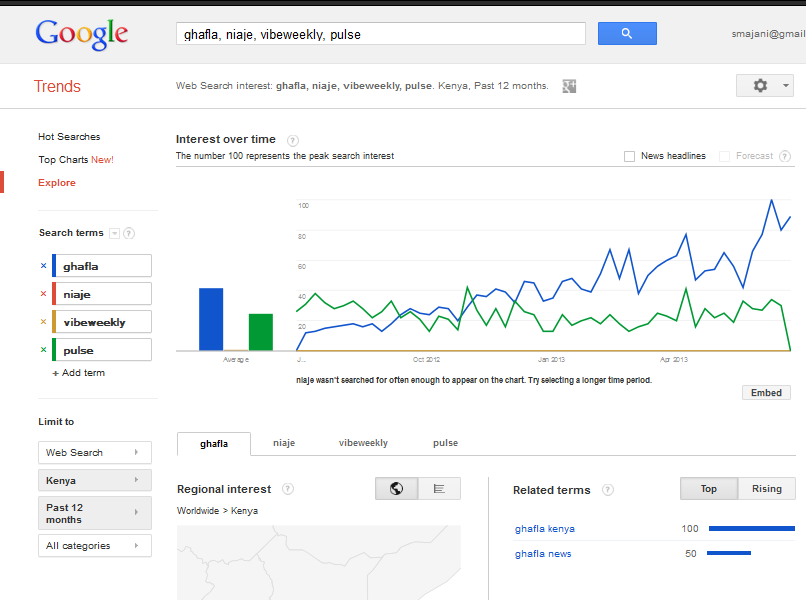
The graphs clearly suggest that Ghafla! and Pulse are the only significantly interesting entertainment entities in Kenya. Though I gave Niaje and Vibeweekly the benefit of the doubt, Google Trends gives them a zero on the interest scale. As you can see at the bottom of the graph, it clearly states, “niaje wasn’t search for often enough to appear on the chart,” while Vibeweekly appears as but a token blip on the screen. The final conclusion we get is that Pulse used to reign back in the day, but Ghafla! has risen to take it’s place as the king of the hill in entertainment.
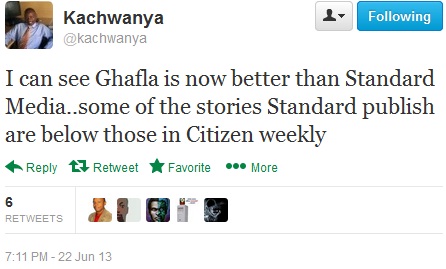
And here’s what tech blogger, Kachwanya had to say on 22nd June 2013 -“I can see Ghafla is now better than Standard Media..some of the stories Standard publish are below those in Citizen weekly”
Next time you want to come talking about how Ghafla! is losing it, come armed with factual evidence to back up your claims.